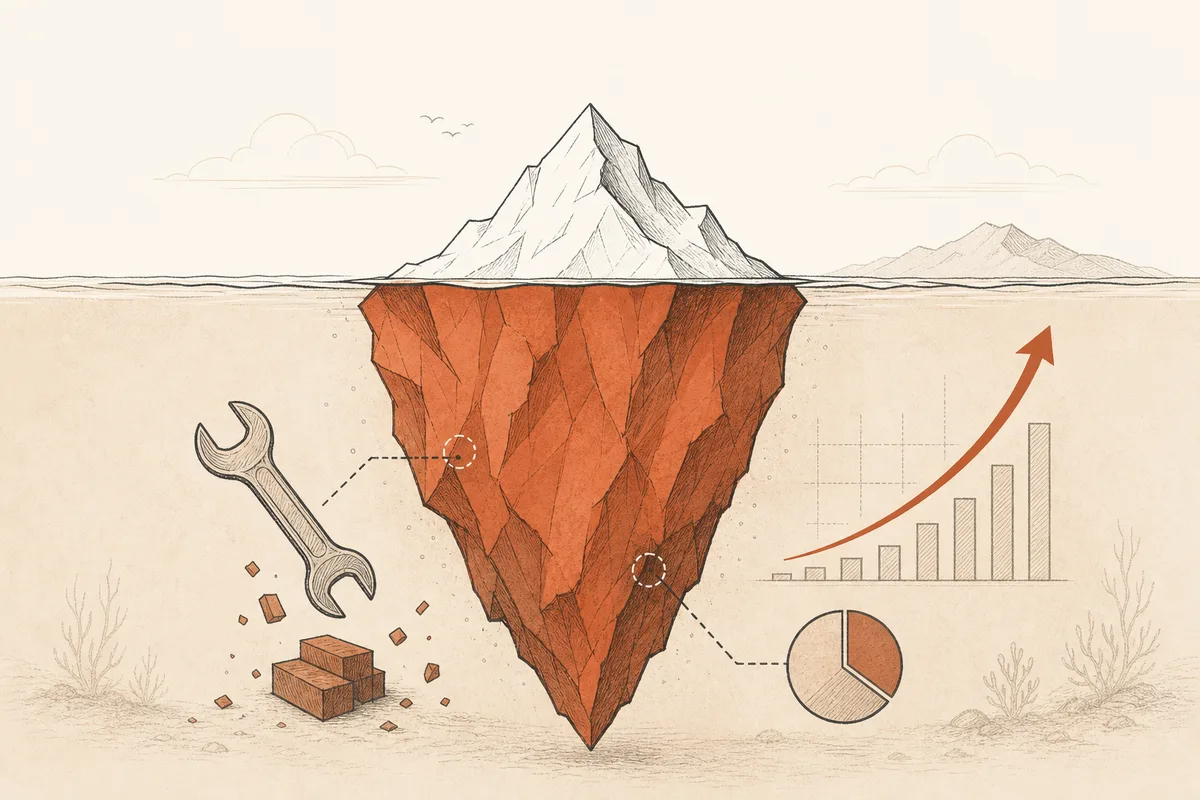
Maintenance can represent 50–75% of a solution's total cost — yet technical debt rarely becomes a real business priority.
While browsing my LinkedIn feed recently, I came across an article by @nventive, a Montreal-based fintech. They raised an important (and often overlooked) topic: the real cost of maintaining digital systems. That figure might sound extreme — but it's a reality many of us in tech recognize.
Everyone in tech has felt the impact of technical debt. It slows teams down, increases bugs, delays features, and makes production deployments riskier. The real problem, to me, is that we fail to communicate that impact in language stakeholders actually act on.
At a glance
- Technical debt hurts delivery speed, quality, and deployment risk — but it stays at the bottom of the backlog without clear metrics.
- Define thresholds, track signals (bugs, lead time, change failure rate), and use frameworks like DORA to make inaction visible.
- Maintenance isn't just a cost — framed as investment in agility, it unlocks sustainable delivery and happier teams.
- The gap isn't awareness among engineers; it's translation into business decisions.
Yes, technical debt hurts — but that's not the problem
Slow releases, rising defect volume, and risky deployments are symptoms teams feel daily. Yet no project manager is going to say:
"Hey team, take the next three sprints to fix technical debt."
We're constantly pressured to deliver visible value — which means tech debt cleanup always ends up deferred. That deferral is the business problem, not the debt itself.
Why is it so hard to get buy-in?
We often fail to communicate the impact in a way that resonates with stakeholders. Engineers talk about refactoring; leaders hear "no new features." Without a shared picture of cost, debt stays invisible until something breaks in production.
What can we do about it?
Tech debt is inevitable. But we can manage it better:
- Define clear thresholds: What level of debt is acceptable? What's a red flag?
- Track it with metrics: Bug volume, lead time for changes, change failure rate — these give real signals
- Leverage DORA metrics: Deployment frequency, lead time, change failure rate, and recovery time help make the cost of inaction visible
| Signal | What it tells stakeholders |
|---|---|
| Rising defect volume | Quality is eroding; customer trust at risk |
| Longer lead time for changes | Innovation slows; competitors gain ground |
| Higher change failure rate | Releases are risky; firefighting increases |
| Slow recovery time | Outages cost revenue and reputation |
With the right data in hand, we can drive better conversations and empower stakeholders to make smarter decisions.
Maintenance isn't just a cost — it's an investment
If we treat maintenance and tech debt reduction as a burden, we'll never fix it. When we frame it as an investment in long-term agility, we unlock more sustainable delivery and happier teams.
The teams I've supported that manage debt well treat it like any other backlog: prioritized, measured, and tied to business outcomes — not a side project that only happens when things catch fire.
Related on this site
I originally shared this perspective on LinkedIn. If you've faced similar challenges, let's talk about making tech debt visible to the people who control priorities.